
Samira Vishwas
Tezzbuzz|11-11-2025
The average first-innings score is a key indicator of how a cricket pitch behaves.
It helps forecast whether a surface favours batters, bowlers, or offers balanced conditions
contests. As India and Australia prepare to face each other across formats in
October–November 2025, the statistics for each venue provide fascinating
insights into the challenges and opportunities awaiting both teams.
Let’s analyse the average first-innings scores for both ODIs and T20Is — and
What they imply for teams chasing victory Down Under.
ODI Venues: Average First-Innings Scores and Key Insights.
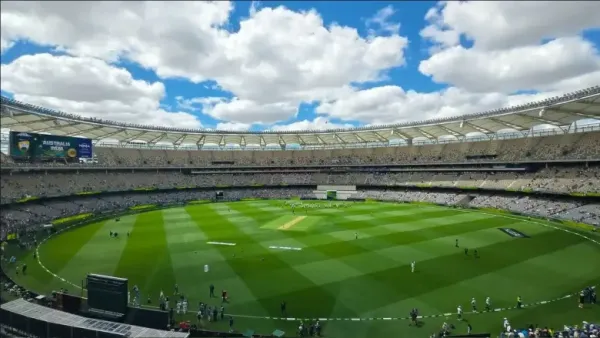
1. Perth Stadium, Perth – Average 1st innings: 172
- Total Matches: 6
- Batting First Wins: 1
- Bowling First Wins: 5
Highest Total: 259/10 (by ENG vs AUS)
Lowest Total: 140/10 (by AUS vs PAK)
Perth Stadium, one of the fastest and bounciest tracks in the world, has
Traditionally favoured pace bowlers. The average first-innings score of 172 is
remarkably low for a modern ODI venue, reflecting how difficult it is for batters
to settle early.
Teams batting first here often struggle against the new ball under lights, as seam
movement and bounce test even the best techniques. Expect totals around 250 to
be competitive, especially with the ball zipping through in evening conditions.
2. Adelaide Oval, Adelaide – Average 1st innings: 225
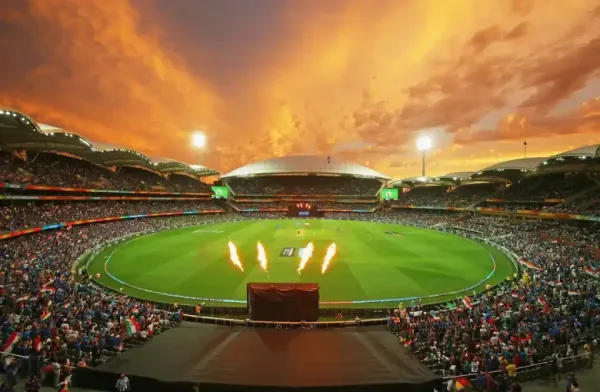
Total Matches: 94
Batting First Wins: 49 | Bowling First Wins: 43
Highest Total: 369/7 (by AUS vs PAK)
Lowest Total: 70/10 (by AUS vs NZ)
The Adelaide Oval is widely regarded as one of the most balanced venues in
World cricket. The average first-innings score of 225 suggests it rewards
batsmen who play risk-free cricket early on before accelerating later.
Under lights, the pitch tends to quicken up, offering ideal conditions for stroke-
makers. Historically, matches here are competitive and often extend deep into
the second innings. A total of 280–300 is generally considered match-winning.
The iconic short square boundaries and quick outfield make it a ground where
partnerships flourish.
3. Sydney Cricket Ground (SCG), Sydney – Average 1st innings: 224

Total Matches: 168
Batting First Wins: 96 | Bowling First Wins: 64
Highest Total: 408/5 (by RSA vs WI)
Lowest Total: 63/10 (by IND vs AUS)
The SCG remains a venue steeped in history — known for its turning surfaces
and true bounce. With an average first-innings score of 224, it is close to
Adelaide’s mark, but spin plays a far greater role here.
As matches develop, the surface often slows down, rewarding disciplined
bowlers and batsmen who can rotate strike. The wide square boundaries test
running fitness and shot placement, making it a tactical ground rather than a
brute-force one. Teams batting first usually aim for 270+ to feel secure.
T20 Venues: Average First-Innings Scores and Trends.
4. Manuka Oval, Canberra – Average 1st innings: 150

Total Matches: 22
Batting First Wins: 10 | Bowling First Wins: 9
Highest Total: 195/3 (by RSAW vs THAIW)
Lowest Total: 82/10 (by THAIW vs RSAW)
A compact ground with true bounce and a lush outfield, Manuka Oval is known
for moderate-scoring T20 matches. The average first-innings score of 150
indicates a balanced contest between bat and ball.
Teams batting first should aim for at least 160–170 to be comfortable, as dew in
night games can make defending smaller totals difficult. It’s a venue that
favours power hitters but punishes poor shot selection.
5. Melbourne Cricket Ground (MCG), Melbourne – Average 1st innings:
141
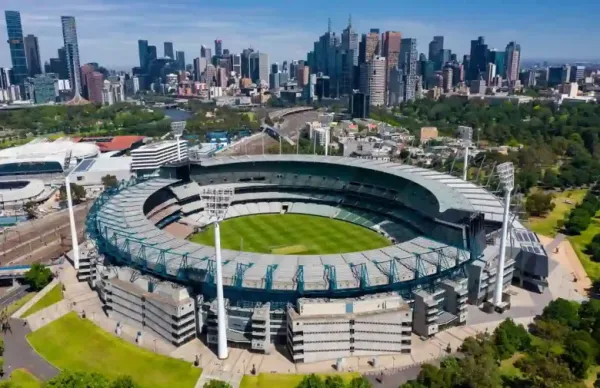
Total Matches: 27
Batting First Wins: 11 | Bowling First Wins: 15
Highest Total: 186/5 (by IND vs ZIM)
Lowest Total: 74/10 (by IND vs AUS)
The MCG, the grand coliseum of cricket, often surprises with its low T20
averages. The 141-run first-innings average highlights how difficult it can be to
find boundaries on its vast playing surface.
Pacers get carry and bounce early, while spinners come into play during the
middle overs. For batsmen, placement and running between wickets are vital
here. A score around 160 remains competitive, although chasing teams
generally perform better thanks to dew and consistent sightlines under the
floodlights.
6. Bellerive Oval (Blundstone Arena), Hobart – Average 1st innings: 147
Total Matches: 20
Batting First Wins: 9 | Bowling First Wins: 10
Highest Total: 213/4 (by AUS vs ENG)
Lowest Total: 117/10 (by PAK vs AUS)
The Bellerive Oval in Hobart, renowned for its picturesque river backdrop,
provides seam-friendly conditions early on, before becoming flatter. The average
first-innings score of 147 makes it one of Australia’s more competitive T20
coming.
Teams that endure the early swing often go on to score heavily. However, totals
above 170 are seldom chased successfully. The venue’s smaller boundaries on
one side make it popular with aggressive right-handers, while crosswinds can
challenge aerial shots.
7. Bill Pippen Oval, Gold Coast – Average 1st innings: 128
Matches: 10 (domestic sample)
1st Innings Avg: 128 | 2nd Innings Avg: 117
Wickets Lost (Avg): 6 in 1st, 7 in 2nd
Set to host its first international T20I in November 2025, the Bill Pippen Oval
promises fresh excitement. Based on domestic data, the pitch here has produced
average first-innings totals around 128, favouring bowlers slightly.
The surface offers movement under lights, while batters find it difficult to
accelerate early. As the venue makes its international debut, both teams will
look to adapt quickly. Early expectations suggest totals around 140–150 could
be match-winning in its maiden series.
8. The Gabba, Brisbane – Average 1st innings: 159
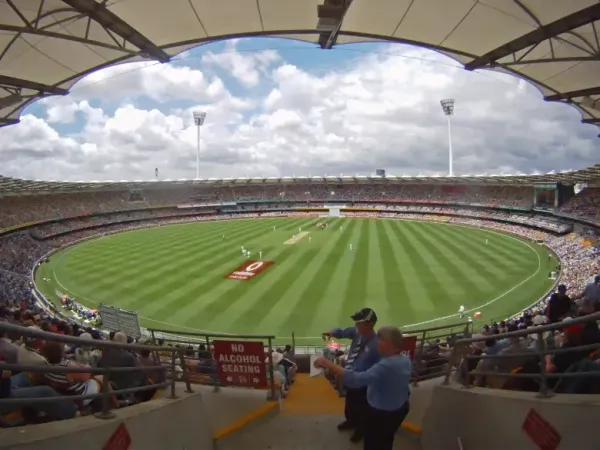
Total Matches: 11
Batting First Wins: 8 | Bowling First Wins: 3
Highest Total: 209/3 (by AUS vs RSA)
Lowest Total: 114/10 (by RSA vs AUS)
The Gabba remains one of the most intimidating venues for visiting teams —
with true pace, bounce, and a lively atmosphere. The average first-innings score
of 159 reflects a ground that rewards intent but punishes recklessness.
Teams batting first often dominate, as shown by the 8-3 win ratio favouring
first-innings sides. Once the ball gets old, the surface eases out, allowing clean
hitters to target square boundaries. Expect totals around 170–180 to be par,
although early wickets can still derail innings quickly.
What the Numbers Reveal
When comparing different formats, the contrast between ODI and T20 venues is
notable:
In ODIs, Adelaide Oval has the highest average at 225, while Perth Stadium has
the lowest at 172. Conversely, in T20 matches, The Gabba records the highest
average at 159, whereas Bill Pippen Oval has the lowest at 128.
ODIs in Australia continue to favour batters, but early movement and bounce
make totals below 250 risky.
T20 venues exhibit much more variation — from flat tracks like Brisbane to
bowler-friendly surfaces on the Gold Coast.
Teams batting first generally need to aim 10–15% above the average to remain
competitive.
FAQs
The typical first-innings score at major Australian ODI venues usually ranges
between 220 and 250 runs. Grounds like Adelaide Oval (225) and SCG (224). They
are batsman-friendly, whereas Perth Stadium (172) tends to produce lower
scores due to its extra pace and bounce.
Australia?
A par score in Australian T20 venues generally falls between 160 and 175 runs,
varying with ground size and conditions. Smaller venues such as Hobart’s
Bellerive Oval often see totals close to 170, while newer venues like Bill Pippen
Oval (Gold Coast) may favour lower totals around 140.
Adelaide and Brisbane?
Both Perth Stadium and the MCG feature pitches that provide extra bounce and
movement, challenging batsmen early on. The larger boundaries at the MCG also decrease boundary frequency, while flatter tracks like those at Adelaide and
Brisbane naturally produces higher scores.


IPL 2026: DC vs RR, Match 62: Stats preview of players' records and approaching milestones

IPL 2026 KKR vs GT Playing 11: Varun Chakravarthy Returns to Riders Lineup

'There is a good chance' - Ashwin hints at MS Dhoni playing his first IPL 2026 match against SRH

IPL 2026: PBKS vs RCB, Match 61: Stats preview of players' records and approaching milestones
